


The production project for the processing of more than 100,000 UAS images
Section: uas data processing
Author: Production Department
 More than 10 % of the Russian territory is occupied by the tundra biome. Despite hard northern climatic parameters, this territory is being actively used and requires actual spatial data. In recent years, unmanned aerial vehicles have become a popular source of detailed aerial imaging data. Aerial imaging in the tundra is quite a difficult task. Daily temperature fluctuations, vast water areas, strong winds, changeable weather, and other factors affect the quality of aerial data. Short imaging season makes you to carry out field survey in extremely short time with a large amount of data. The requirements for the process of photogrammetric data processing are also increasing.
It is such a challenging project that our company completed last autumn. The customer provided us with a bulk of aerial data that comprised more than 100,000 images for an area of 300 sq. km (blue boundaries in Fig. 1). The difference in elevation was not large and was about 56 meters. Trees were almost absent in the imagery, dwarf groveling shrubs, lichen, and moss prevailed. Buildings were sporadic. Most of the territory was covered by water: rivers, oxbows, thermokarst lakes, and flat bogs.
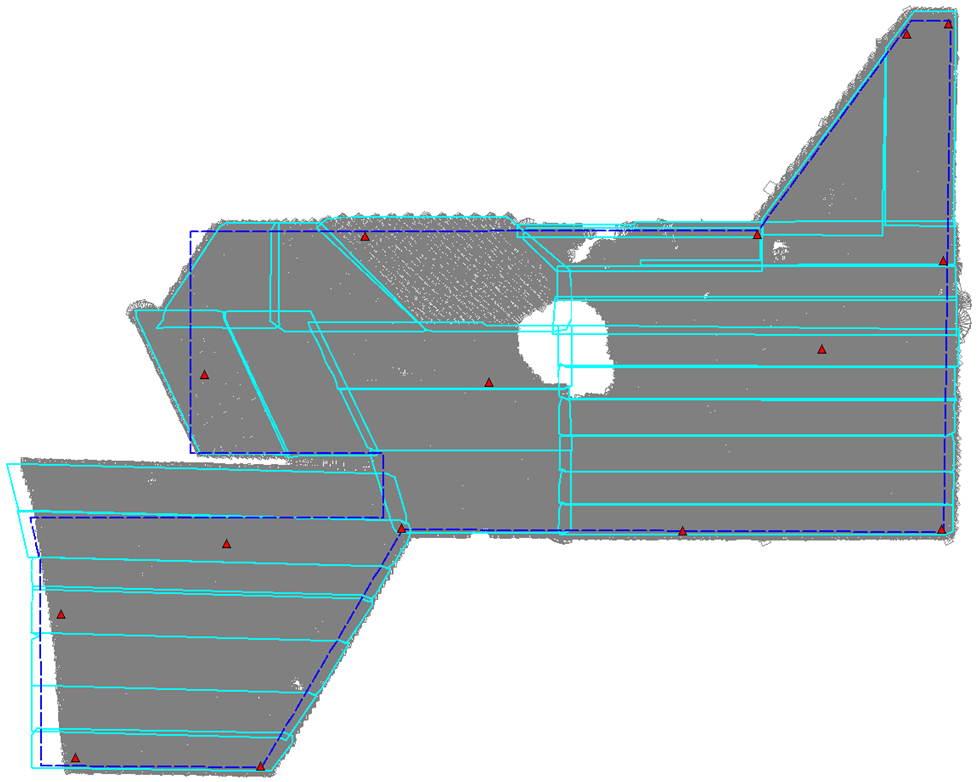
Fig. 1. Total package of aerial images for the whole territory
All images were obtained from a single UAS equipped with 3.4 cm spatial resolution SONY DSC-RX1RM2 camera. Since the imaging was performed by a single aircraft, the survey took about a month. Imaging conditions varied, both with a change in the time of day and with a change in weather conditions from day to day. Finally, images obtained during 27 flights were processed together. Flight boundaries (cyan color) can be seen in Fig. 1. For the photogrammetric processing, all the images were divided into 4 blocks consisting of 20-30K images each. The imaging materials were supported by 15 ground control points (GCP) (in Figs. 1 and 2, ground control points are denoted with red triangles). The claimed accuracy of determining coordinates of shooting centers of in flight, after post-processing was 20 cm. This allowed us to adjust blocks with 50 cm accuracy.
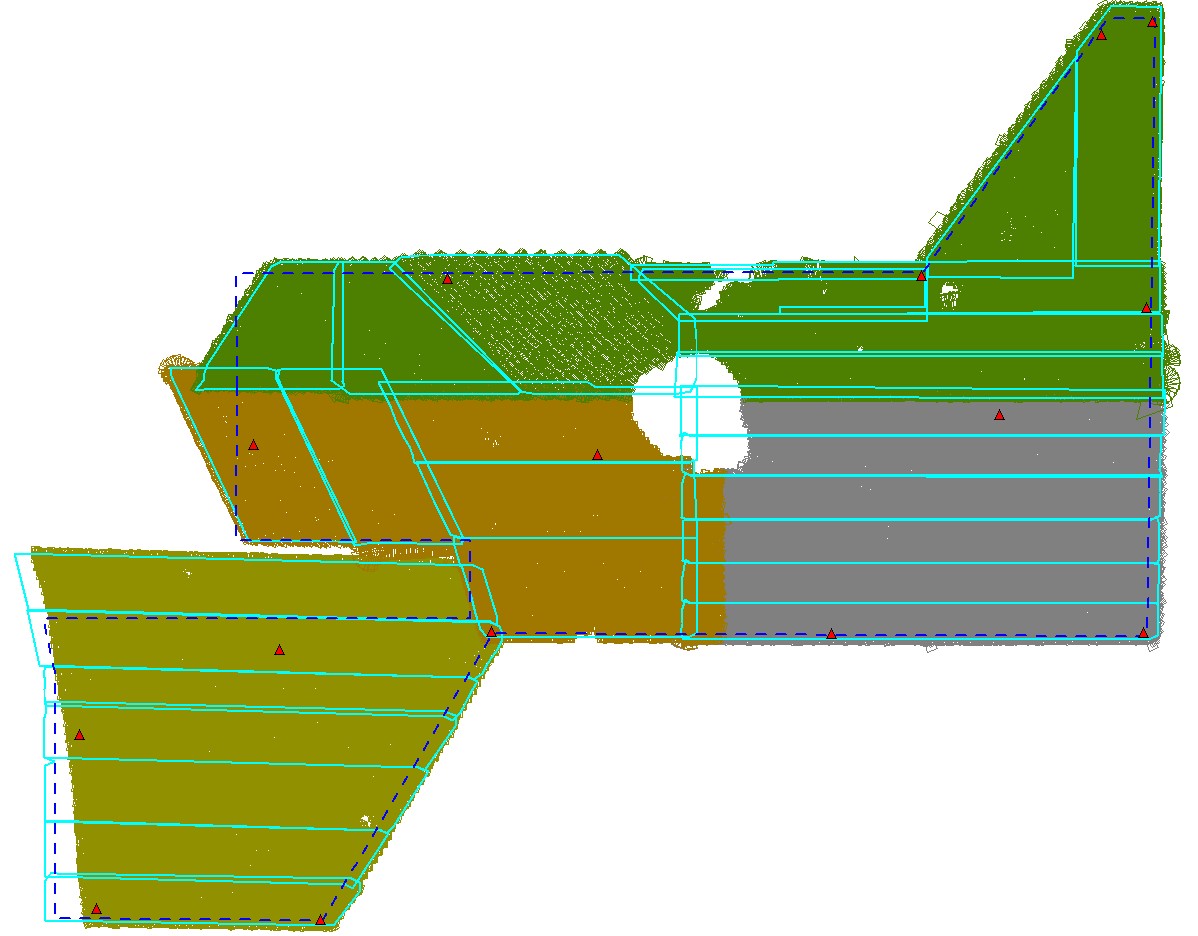
Fig. 2. Dividing into 4 photogrammetric blocks
All four blocks were processed applying a single technology. Tie points were set automatically, 1.5-2.5M points in each block in total. A fragment of one of the triangulation block adjustment reports is given in Fig. 3.
Table 1. Accuracy assessment at GCPs and checkpoints
| Camera | DSC-RX1 |
| GSD, m | 0.034 |
| Coordinate system | SK-95, zone 13 |
| Height difference, m | 0.0 - 35.0 |
| Total area, m2 | 93386029.45 |
| Images | 28949 |
| Stripes | 101 |
| Tie points | 2583704 |
| GCP | 3 |
| Check points | 2 |
Tables 2 and 3. 1st photogrammetric block adjustment report fragment
| N |
Accuracy, X, Y, Z |
Ex, m | Ey, m | Ex, m | Exy, m |
| 11 | 0.100/0.100/0.100 | 0.055 | -0.039 | -0.006 | 0.067 |
| 14 | 0.100/0.100/0.100 | -0.158 | 0.017 | 0.011 | 0.159 |
| 16 | 0.100/0.100/0.100 | -0.133 | -0.090 | -0.005 | 0.160 |
| RMS, m | ---- | 0.123 | 0.057 | 0.008 | 0.136 |
| Module, m | ---- | 0.115 | 0.049 | 0.007 | 0.129 |
| Max, m | ---- | 0.158 | 0.090 | 0.011 | 0.160 |
| N |
Accuracy, X, Y, Z |
Ex, m | Ey, m | Ex, m | Exy, m |
| 13 | 0.100/0.100/0.100 | 0.074 | -0.115 | 0.054 | 0.137 |
| 15 | 0.100/0.100/0.100 | -0.007 | -0.006 | -0.000 | 0.009 |
| RMS, m | ---- | 0.053 | 0.082 | 0.038 | 0.097 |
| Module, m | ---- | 0.041 | 0.061 | 0.027 | 0.073 |
| Max, m | ---- | 0.074 | 0.115 | 0.054 | 0.137 |
We needed to obtain orthophotos with ground resolution no worse than 6 cm and contour lines with 0.5 m intervals. Digital terrain models (DTM) with 5 cm step were created for each block (Fig. 4). All the images were orthorectified and a single orthomosaic with color adjustment was created, which was divided into sheets (Fig. 5). Orthophotos were obtained within 1:2000 notation sheets in the tiff format. The results of hue and color adjustments are given in Figs. 5 and 6.
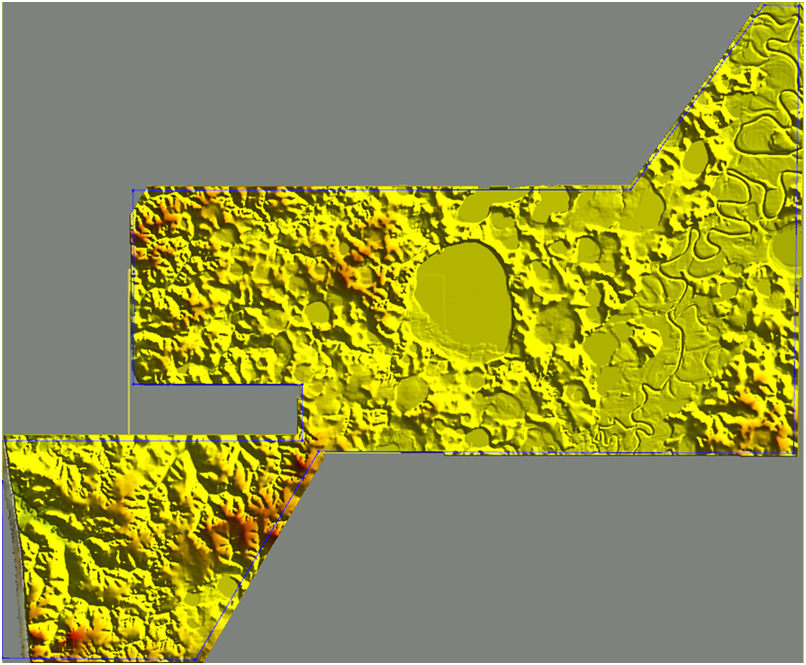
Fig. 4 Digital terrain model
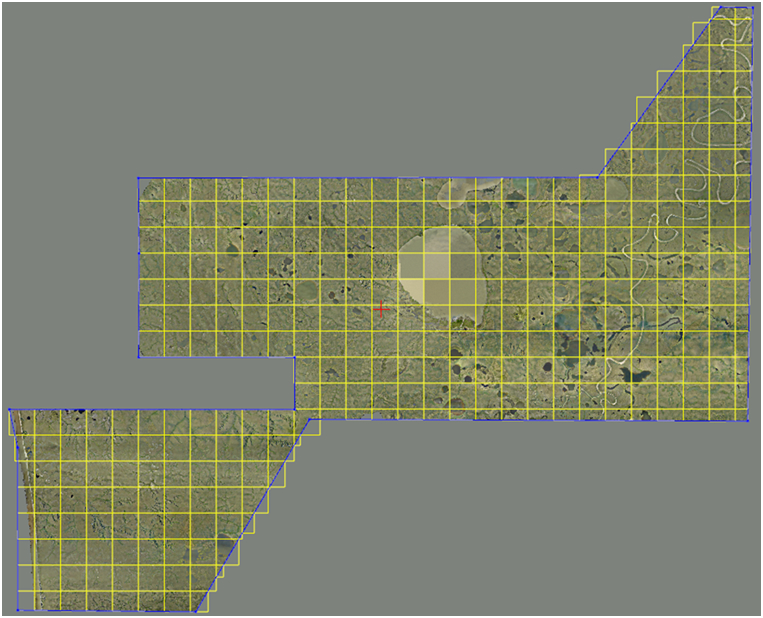
Fig. 5 Orthophotos for the whole surveyed territory
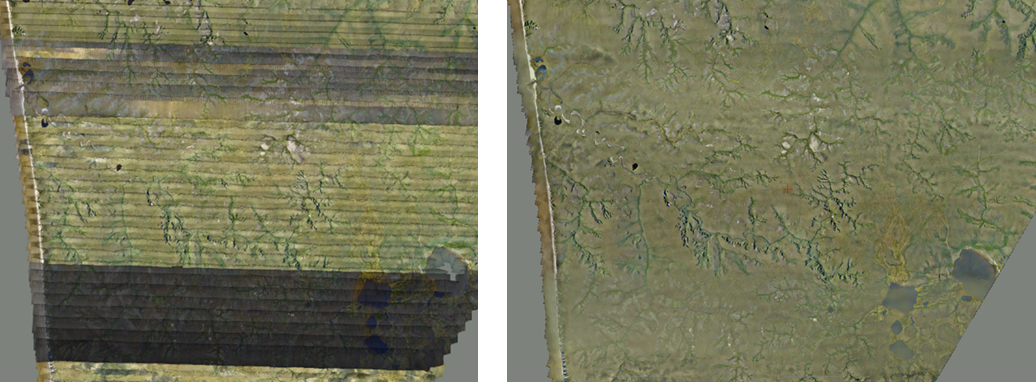
Fig. 6. Left — a fragment with initial images of one of the blocks, right — an orthomosaic for this territory
Contour lines are built automatically using digital elevation models, split into sheets, and exported into ArcGIS and AutoCAD formats. The process of contour line creation started in parallel to the image transformation process.
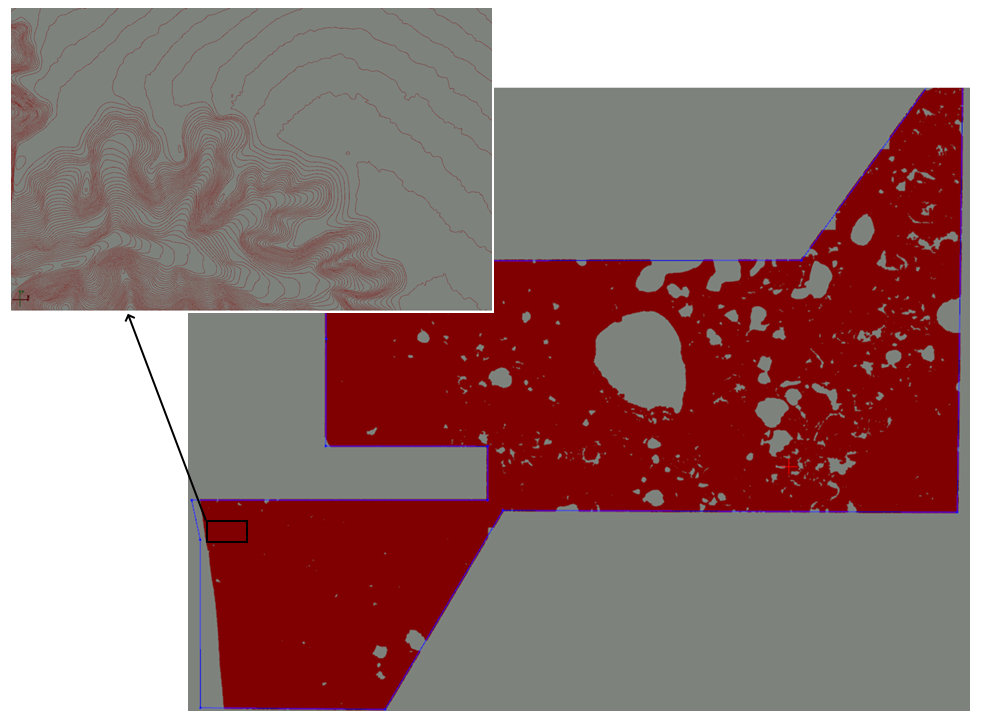
Fig.7. Contour lines for the whole surveyed territory.
All the processing was carried out in the distributed mode using the network configuration of the DPW PHOTOMOD using 4 computational nodes, each contained 12 cores and 48 GB of RAM. The project was carried out in automatic mode, the operator's participation was reduced to the functions of control and selection of processing parameters. The total time spent on the project was one month.
Practical experience gained in the course of the project has allowed our developers to optimize the work of DPW PHOTOMOD with a large (100,000 and more) number of images.
Racurs’ production department is filled with qualified personnel who have vast experience in the implementation of various projects. In cooperation with our partners, we are armed with sufficient technical and human resources to implement projects of practically any size and complexity. Please, contact us: info@racurs.ru, tel.: +7-495-720-51-27