


Estimation of KOMPSAT-3 Imagery Potential for DSM Creation
Section: satellite data processing
Source: Racurs, 2016
Author: A. Zubarev
The present research was a stage of the complex project on KOMPSAT-3 stereo images testing conducted by specialists of Racurs company in DPW PHOTOMOD.
Introduction
Presently, satellite stereo survey becomes more and more popular. Many new RSD satellites will be launched in the next years and dozens are successfully operated today. Racurs's team has tested KOMPSAT-3 stereopair (GSD = 0.8 m, convergence angle = 44 degrees) and evaluated accuracy of KOMPSAT-3 digital surface model (DSM) vs DSM from aerial survey (GSD = 0.18 m).
The following characteristics of KOMPSAT-3 data were tested:
- RPC accuracy;
- Stereopair inner geometry;
- Stereopair DSM accuracy comparing with aerial survey DSM.
The estimation of RPC accuracy and internal geometry of stereopair
10 well-recognizable terrain objects (building and fence corners, road intersections) were used as the ground control points (GCP) in the test. The coordinates of GCPs were measured on the images of the high accuracy aerial survey project.
The adjustment of KOMPSAT-3 stereopair with using no GCPs (bias method) gives the estimation of the source RPC coefficients (RMSxy = 18.1 m and RMSz = 0.65 m). Usage of only one GCP allows to compensate systematic RPC errors. The final adjustment errors on check points for this experiment are: RMSxy = 0.8 m and RMSz = 0.65 m. In the experiment with all GCPs included into the adjustment RMSxy = 0.42 and RMSz = 0.42 m (on control points).
Output DSM quality estimation
In order to estimate the accuracy of DSM built by KOMPSAT-3 stereopair we used the reference DSM for the same area computed by the aerial survey project mentioned above (UltraCam camera). “Aerial” DSM has the cell size = 0.18 m while the “satellite” DSM cell size is equal to 0.7 m. Both DSMs were built by using the same SGM algorithm in PHOTOMOD 6.02 to make the experiment more objective.
Fig.1 shows DSM from KOMPSAT-3, Fig. 2 represents DSM calculated from the aerial imagery.
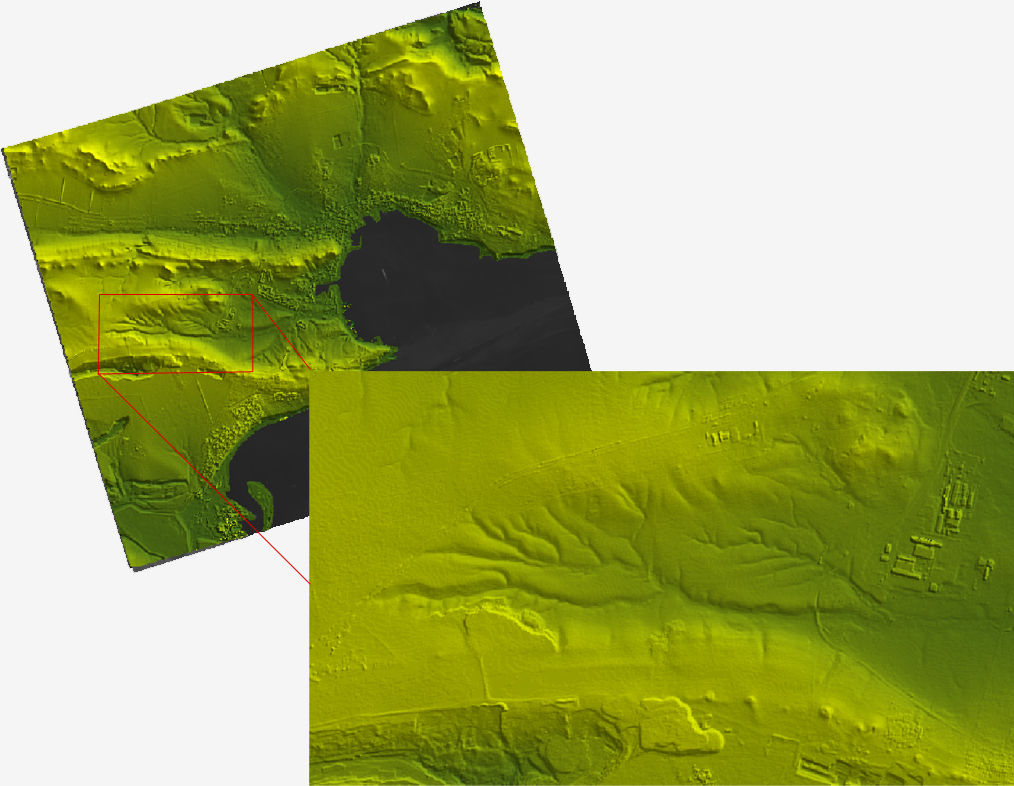
Fig. 1. DSM from KOMPSAT-3 stereopair.
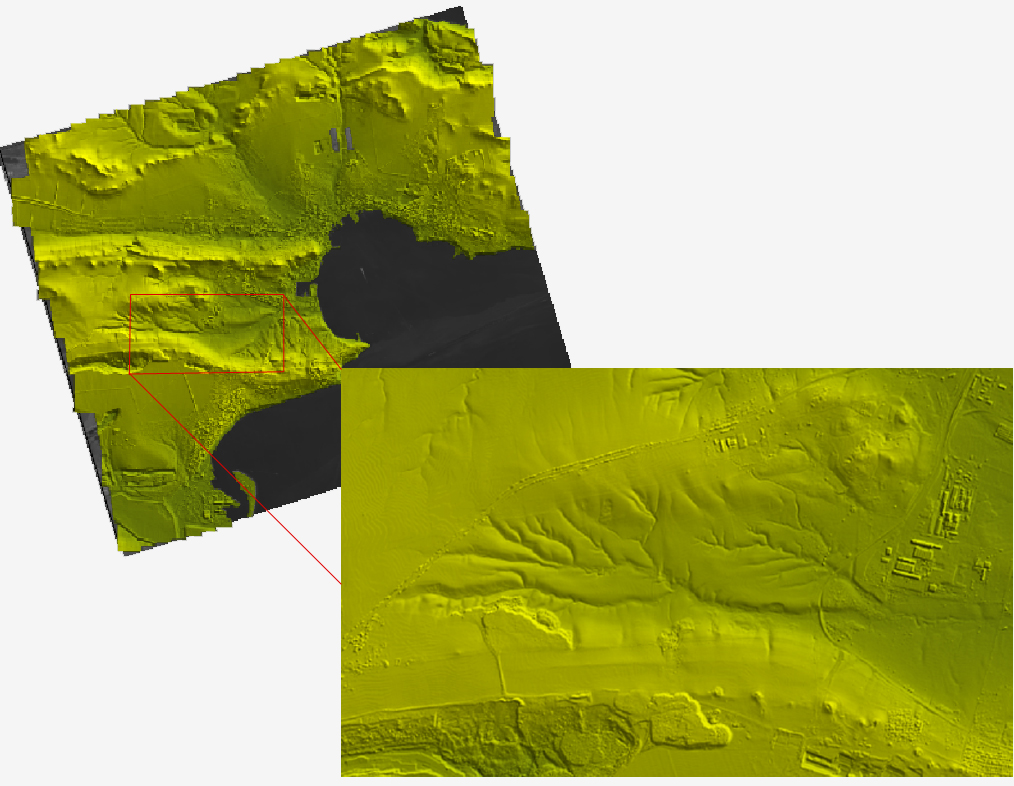
Fig. 2. DSM from the aerial survey.
Calculation of histogram illustrated on Fig.3 was based on the Difference DEM. The Difference DEM was computed by dividing “aerial” DSM from “satellite” DSM.
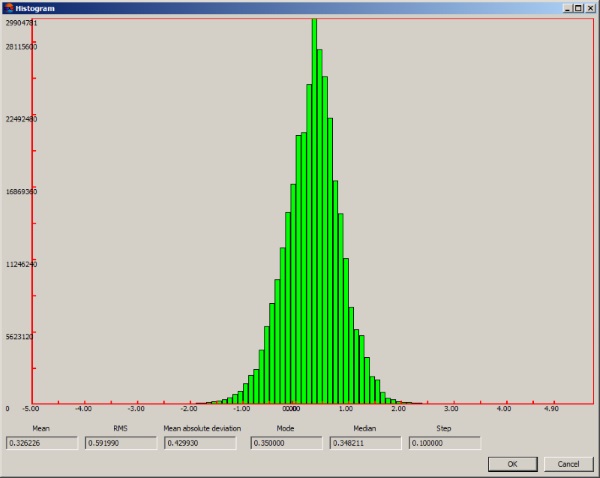
Fig. 3 Histogram based on a Difference DEM.
During the accuracy estimation the area was divided into three types according the following categories:1. area with rivers and low degree of vegetation coverage,
2. rough terrain area with quarries, ravines,
3. urban area with city infrastructure (buildings, bridges, etc).
Taking into account these 3 categories histograms of Difference DEMs were created. Histograms are presented on Fig. 4 – Fig. 6.
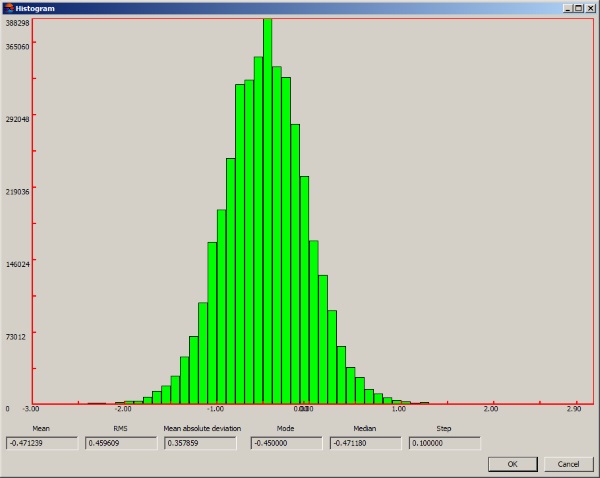
Fig. 4 Difference DEM for the Category 1 (area with rivers and low degree of vegetation coverage).
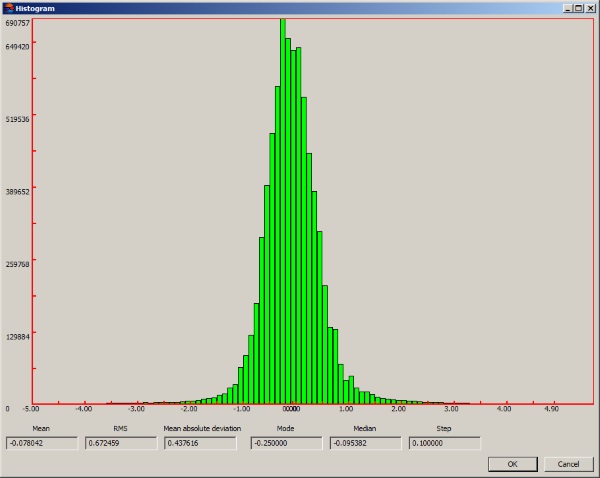
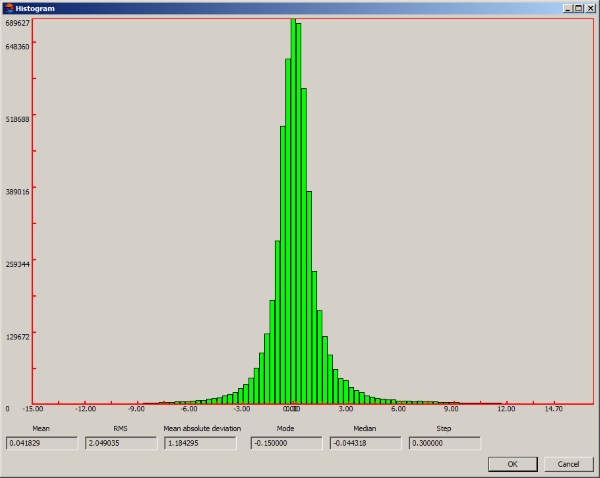
Fig. 5 Difference DEM for the Category 2 (rough terrain area with quarries, ravines).
After analyzing these histograms we can make the following conclusions:
1. Systematic DSM errors (both XY and Z) are very minimal (not greater than 0.2-0.4 m) that corresponds the adjustment accuracy and makes the further analysis possible;
2. All histograms have normal distribution shape typical for the case of random errors only;
3. Histograms from Fig. 4 – 6 look very similar but the histogram of the category 2 has more values over 2 meters in comparison with the histogram of the category 1. The main reasons of some inaccuracy in detecting edges of quarries are the big convergence angle and small number of images in the project (only two). As a result we have many blind areas over the stereopair;
4. Histogram 3 (Fig. 6) has maximim number of relevant exceeding 2 meters since the urban area has the biggest number of blind fragments.
These results of experiments enable to consider KOMPSAT-3 stereo images as a data with high geometrical quality. Vertical accuracy is differing in accordance with the area type:
RMSE = 0.46 m for area with rivers and low degree of vegetation coverage;
RMSE = 0.67 m for rough terrain area with quarries and ravines;
RMSE = 2 m for urban area with city infrastructure (buildings, bridges, etc).
Thus, RMSE for all plot area equals 0.6 m.
High vertical accuracy for this data is a result of geometrical quality and an optimal intersection angle = 44 degreases.